Why Same Standard Deviations Can Lead to Different Results — Fair Variability Comparison Using Coefficient of Variation (CV)
1. Why Do We Need CV? What Was the Problem?
Let's think about this.
10 ÷ 100 = 0.1
10 ÷ 1,000 = 0.01
The numerator (10) is the same, but when the denominator changes, the result is completely different. → The larger the denominator, the smaller the result, and the relative meaning changes.
This same principle applies to comparing data variability. When the mean of data differs, even the same Standard Deviation (SD) has different relative variability significance.
However, in many cases, people simply compare only standard deviations without considering the mean. As a result, they often reach wrong conclusions.
Here are typical examples:
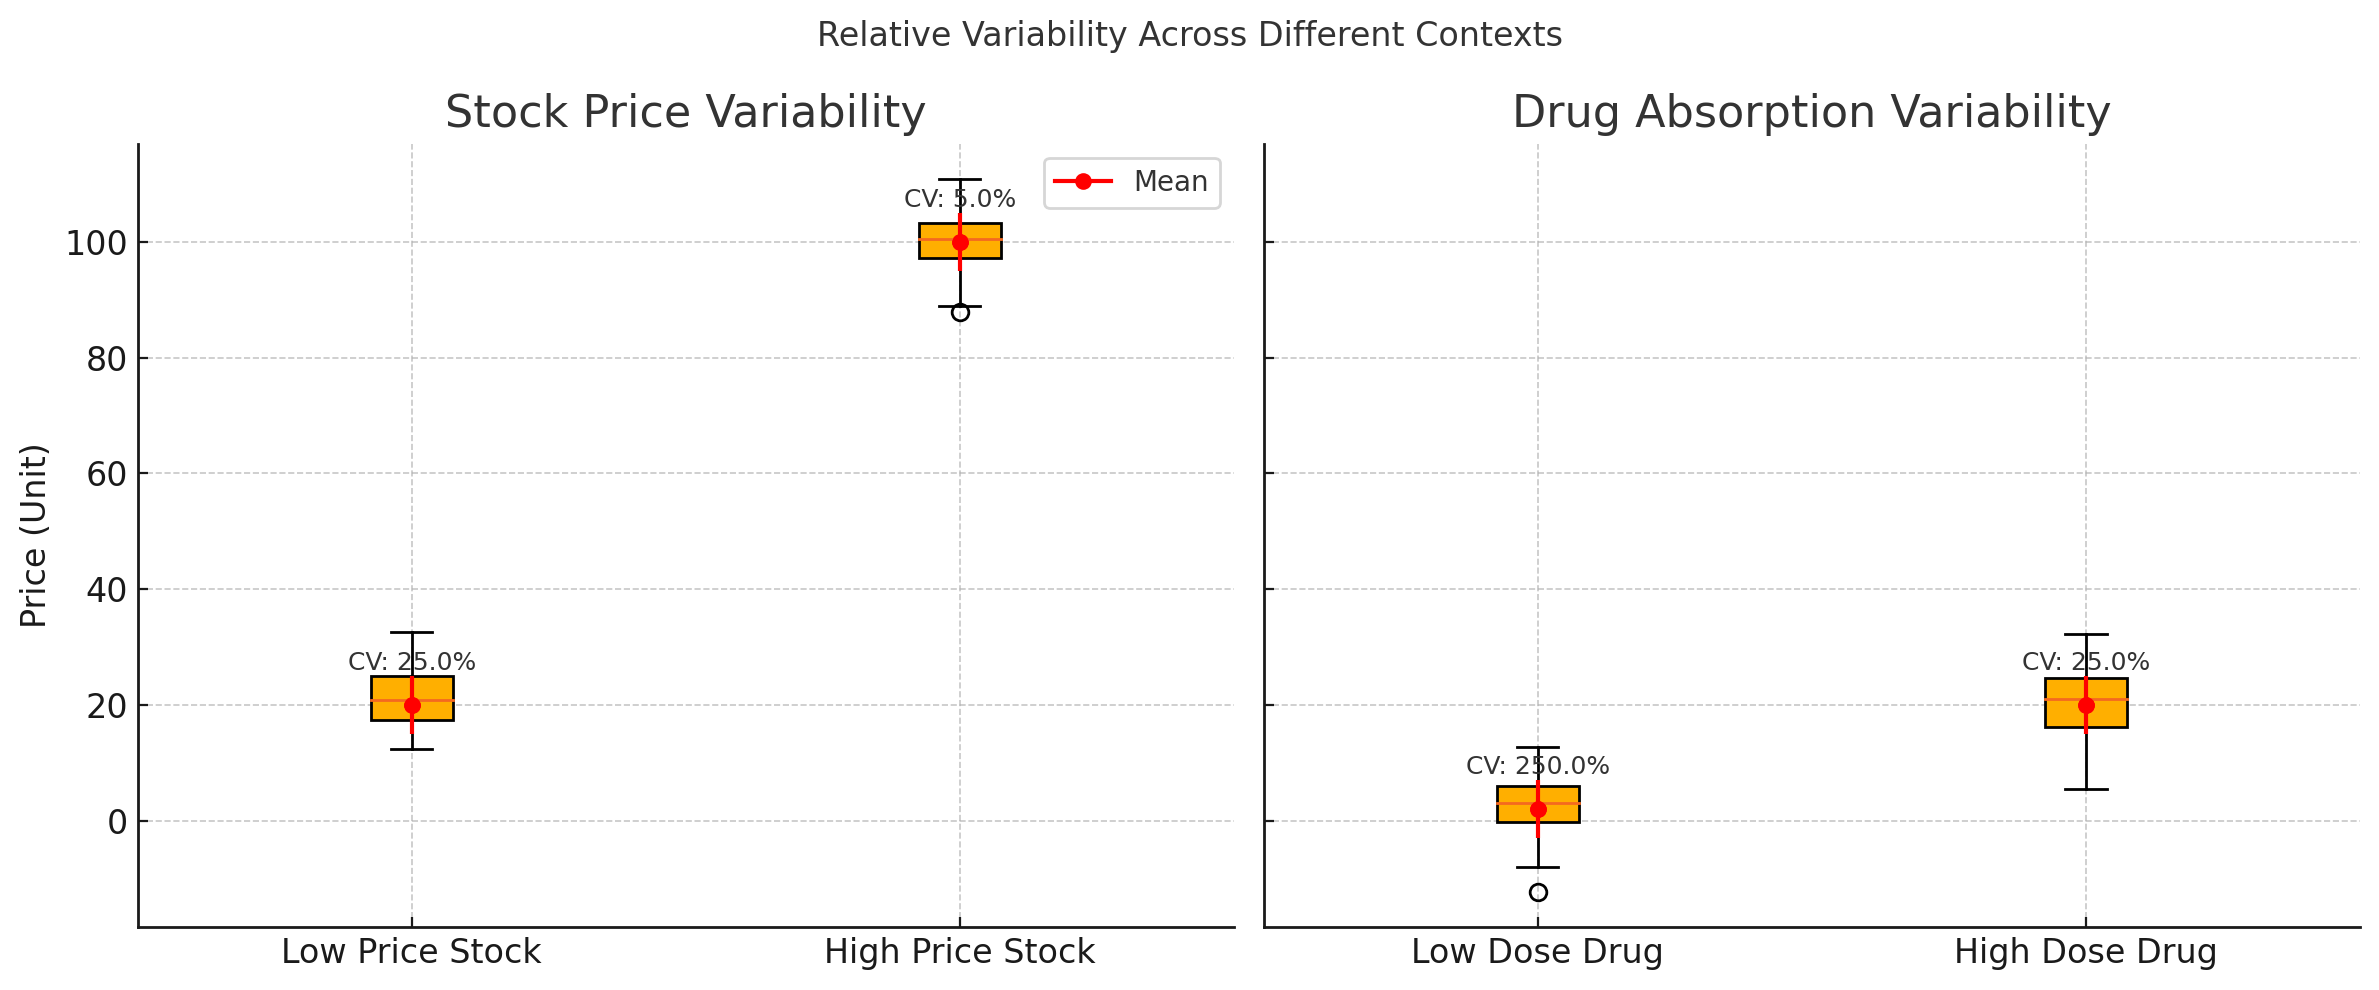
Example 1: Low-priced vs High-priced Stock Volatility
| Stock Type | Average Price | Standard Deviation | CV (%) |
|---|---|---|---|
| Low-priced Stock | $20 | $5 | 25.0 |
| High-priced Stock | $100 | $5 | 5.0 |
Both stocks have a daily price fluctuation of $5, but:
- Low-priced stock shows 25% volatility relative to its average - highly unstable
- High-priced stock shows only 5% volatility relative to its average - stable
➡ Looking at standard deviation alone: "Both have $5, so they're similar" ➡ In reality: Huge difference in relative stability
Example 2: Low-dose vs High-dose Drug Absorption Variability
| Drug Dose | Average Absorption | Standard Deviation | CV (%) |
|---|---|---|---|
| Low-dose | 2 mg | 5 mg | 250.0 |
| High-dose | 20 mg | 5 mg | 25.0 |
Both cases have the same absorption variability of 5 mg, but:
- Low-dose drug has variability 2.5 times the average - very unstable
- High-dose drug has only 25% variability relative to average
➡ Standard deviation alone suggests similar stability ➡ In reality: Dramatic stability difference based on dosage
2. How Do We Solve This?
The solution is Coefficient of Variation (CV).
CV is standard deviation divided by the mean, showing relative variability by considering data scale differences.
This process is essentially normalizing variability by the mean. Instead of just "how much it varies," it shows "what percentage it varies relative to the average."
Through this normalization:
- We can fairly compare variability regardless of average size
- Relative stability differences between different-scale data become clear
📐 CV Calculation Formula
CV = (Standard Deviation / Mean) × 100Now with CV, we can clearly see real stability differences that aren't visible from standard deviation values alone.
3. What Effects and Limitations Did This Have?
✅ Benefits of Using CV
- Fair comparison of variability even when means differ
- More intuitive expression as percentage (%) rather than units
⚠️ Limitations of CV
- CV values explode or distort when mean approaches zero
- Careful interpretation needed for data with negative values or non-normal distributions
- CV doesn't explain the underlying causes of variability
🔍 Conclusion
Coefficient of Variation (CV) is a relative variability indicator for fair comparison of different-scale data. It's an important tool that shows "how stable relative to the average?" which standard deviation alone might miss. However, don't judge data quality by CV alone - interpret it within data context is essential.